
This article shows you how to fix website errors by locating and using tools on the Website Audit page. Audit information identifies errors, rates their severity, and suggests ways to fix these problems.
- The audit tool looks at the structure of your website and tries to find errors. This is different from Search Ranking (which is about performance on a search engine) and keyword optimisation (which is about making a strong connection between page content and keywords).
To find website errors, Sinorbis software crawls every site on the platform. Elements of a website which do not conform to our understanding of best practices (e.g. bad headers, poor titles, broken links, etc.) are identified as errors.
Crawl data are summarized on the Website Audit page. These data are:
- Key metrics summary data
- Latest Crawl Summary
- Audit Trend
1 Locating website audit data
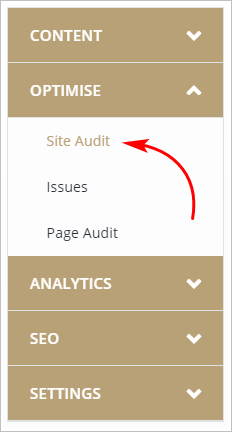
You can find website audit data in the OPTIMISE folder.
- Click WEBSITE on the top menu bar. The Website Content page displays.
- Locate the menu on the left side of the page.
- Click the OPTIMISE folder. The folder opens with three page links.
- Click Site Audit. The Website Audit page displays.
2 Reading key metrics data
The top of the Website Audit page has three boxes of data. They are indicators of website performance based on crawl data. Each indicator is explained below.
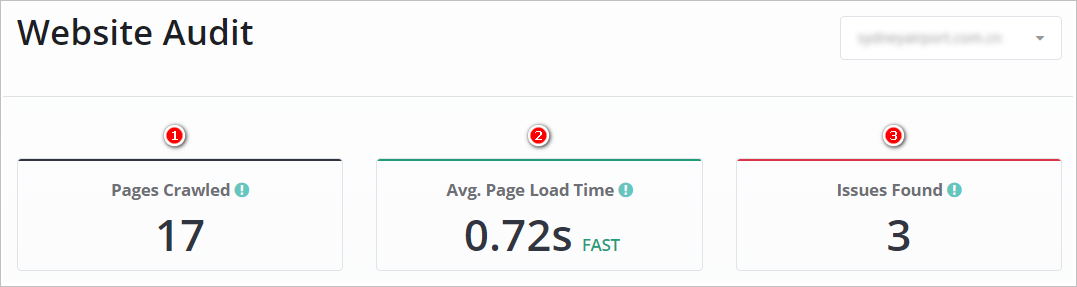
1 Pages Crawled
The number of website pages visited during the most recent crawl.
2 Avg. Page Load Time
The average page load time for the entire website measured in seconds.
3 Issues Found
The number of optimisation issues found during the latest crawl. Specific issues, either Health or Content, described in detail below.
3 Reading crawl summary data
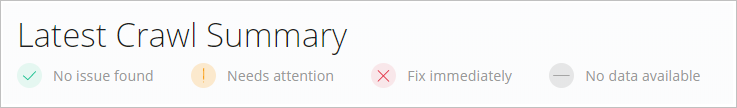
Crawl summary data are presented in two tables. The tables are called Health and Content. Each item in the tables gets a rating. The ratings help you decide what action, if any, is required.
There are 4 colour-coded ratings:
- No issues found
- Need attention
- Fix immediately
- No data available
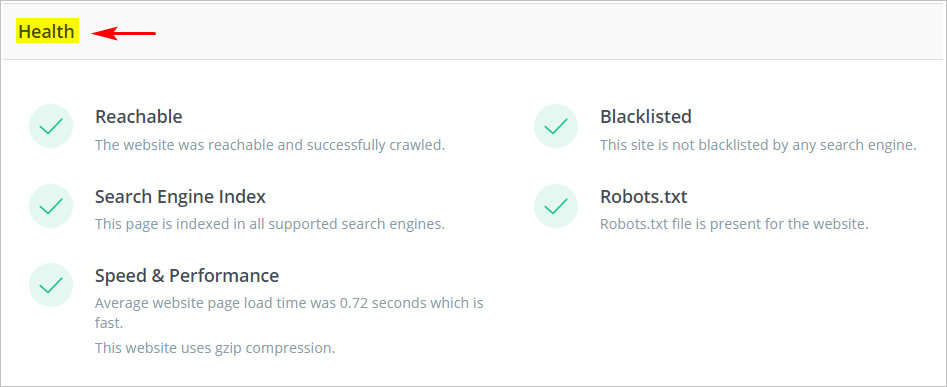
Health table
The Health table has 5 items. In the image below, this website has no health problems.
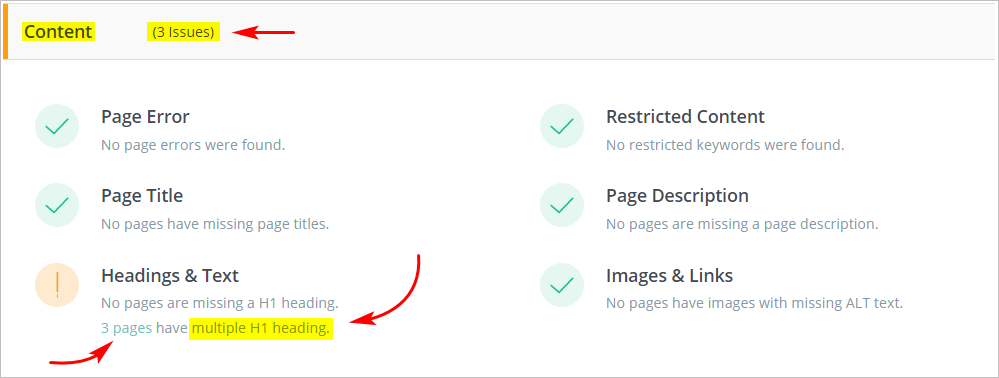
Content table
The Content table has 6 items. In the image below, the crawl found 3 issues, which are highlighted by an amber symbol (i.e. Need attention).
The issue information includes:
- type of error (e.g. Heading and Text)
- error detail (e.g. multiple H1's)
- links to the pages with errors
4 Fixing errors
Errors reported in the Health or Content tables cannot be fixed on this page. To fix these errors, click the links. The links take you to the Optimisation: Issues page. Here, you can read descriptions about the problems and solutions.
For more information, see:
5 Reading audit trend data
Audit trend is a chart that provides a timeline of pages crawled and error messages.
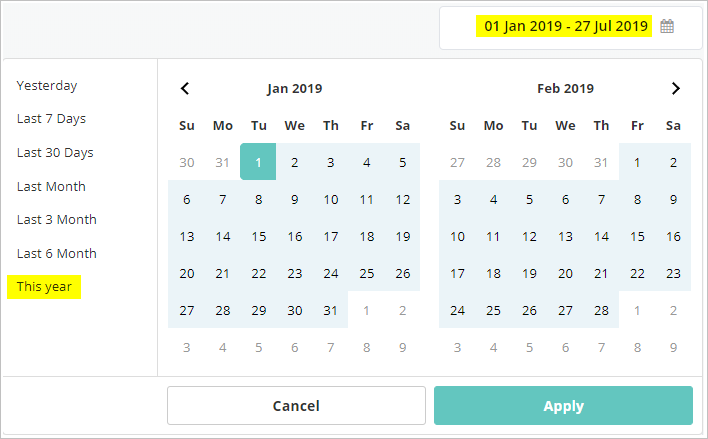
Selecting a date range
Click the Date Picker and select a date range. Use a preset range or choose a custom range.
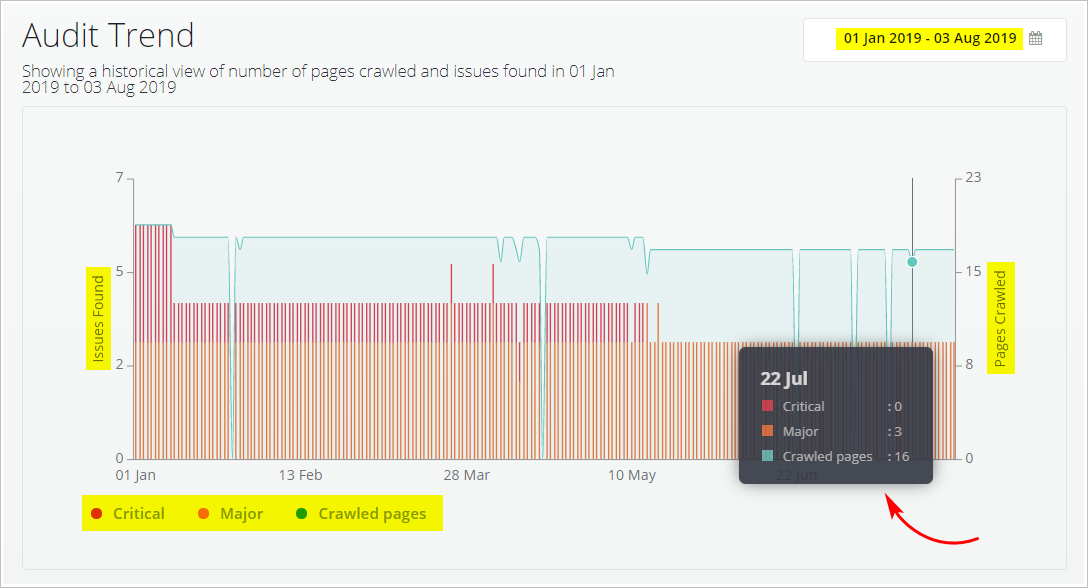
Reading audit trend data
The audit trend chart shows three data sets over the selected date range: critical errors, major errors, and crawled pages.
- Hover the mouse pointer on a label below the chart to isolate that data set in the graph.
- Hover the mouse pointer over data in the chart to see specific information for a given day.
Comments
0 comments
Please sign in to leave a comment.